
Implications of Precision Metabolic Testing Using Doubly Labeled Water
Introduction
Doubly labeled water (DLW) is the gold standard method for measuring human energy expenditure under free living conditions. It is a thoroughly validated form of indirect calorimetry, and the only method to measure energy expenditure in any environment [1]. As indicated by its name, DLW is water that has both its oxygen and hydrogen labeled with heavy, non-radioactive isotopes (oxygen-18 and deuterium respectively) [2]. While it is the gold standard measurement, only 10,485 measurements of total daily energy expenditure (TDEE) are hosted in the DLW database [4].
The method was discovered in 1949 by Nathan Lifson at the University of Minnesota and was first tested in mice in 1955 via injection of oxygen-18 labeled water and breathing of enriched air — ultimately proving that body water is in equilibrium with respiratory carbon dioxide [3,5]. Other small animals were tested into the 1970's, but humans weren’t tested until the 1982 when the rising cost of obesity, heart disease, and other metabolic irregularities finally justified the high cost of DLW doses required for human testing [5].
DLW Theory and Method
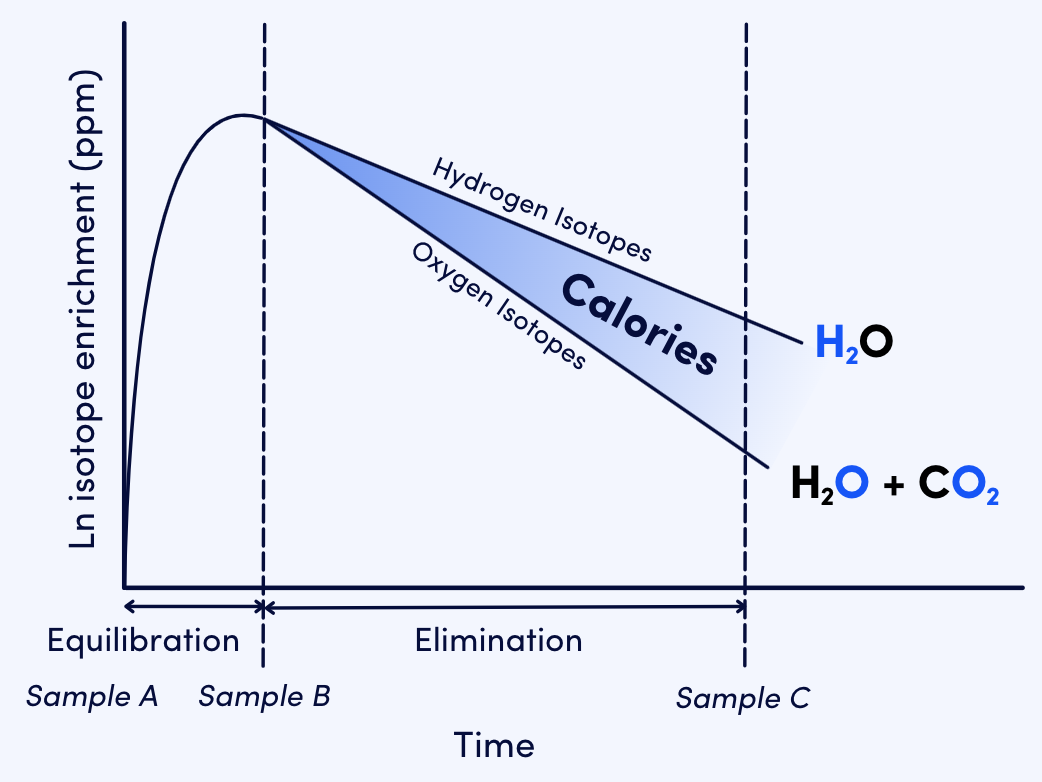
Figure 1. The course of enrichment for oxygen and hydrogen isotopes throughout the course of a DLW test. Samples A, B, and C are indicative of when urine samples are taken over the course of a DLW test. (Adapted from Speakman 1998, figure 2. [5])
Note: x-axis is not to scale—dramatized for illustrative purposes.
DLW is labeled with both heavy oxygen and heavy hydrogen, allowing us to follow the fluxes of oxygen and hydrogen throughout the body. “The fundamental basis of the DLW method is that oxygen turnover in the body is dominated by the flow of water through the body as well as inspired oxygen and expired carbon dioxide.” [5]. Oxygen is expelled from the body faster because it is washed out by both water and carbon dioxide, while hydrogen is flushed out solely by water. The resulting difference between expulsion rates is total calories burned over the course of the test [5]. This expired carbon dioxide is the product of cellular respiration, aka calories burned. Figure 1 demonstrates the course of enrichment throughout a DLW test. Urine samples are taken before being dosed with DLW (A), 4-6 hours after drinking the DLW (B), and 7 days later (C). DLW equilibration with total body water (TBW) takes place between samples A and B. DLW elimination occurs between samples B and C.
In addition to TDEE, the DLW method also measures body composition. The underlying observation that makes this measurement possible is that water only travels through lean body mass (LBM) via the body water pool, and that this water does not travel through fat mass (FM). TBW is then measured by isotope dilution as shown in figure 2. TBW can then be equated to LBM, and FM can be calculated out by subtracting LBM from total weight. This is a gold standard technique and has comparable accuracy and precision to a DXA scan [6].
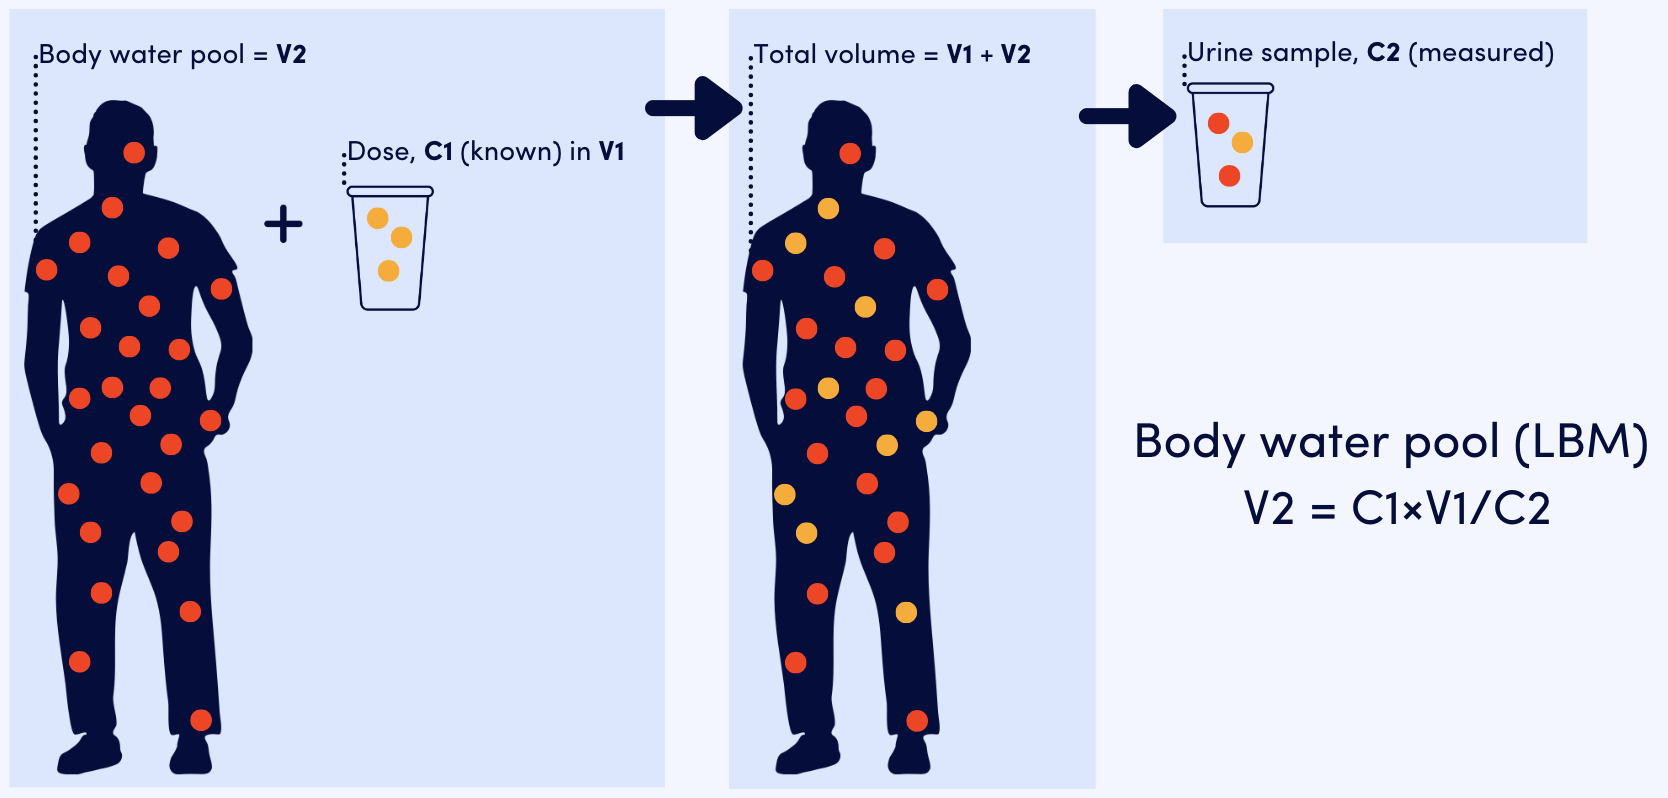
Figure 2. Deuterium dilution graphic illustrating the difference in isotope concentration before and after dosing with DLW.
Advances in Technology
Calorify wouldn’t be here without advances in technology within academia. It wasn’t until the 1990’s that the laser absorption spectroscopy that Calorify relies on was developed. Prior to these developments, mass spectrometry (commercially available since the 1940s) was used to make DLW measurements [6]. Calorify uses what is known as off-axis integrated cavity output spectroscopy (OA-ICOS). Developed in 1998 and expanded upon in 2001, OA-ICOS increases sensitivity through playing with Beer’s Law by shining the laser off axis, increasing the pathlength [6]. OA-ICOS is both sensitive and robust, giving us tremendous confidence in the measurements being made [6].
We have expanded upon the advancements of OA-ICOS by optimizing our run patterns such that we reduce the time taken to run each sample and reduce the price associated with running each set of samples.
Finally, Calorify has made DLW accessible at-home--no lab visits required. This reduces the time cost associated with testing in a lab, not to mention the overall reduced monetary cost of receiving accurate expenditure, body composition, and more in one kit.
Notable Discoveries Using DLW
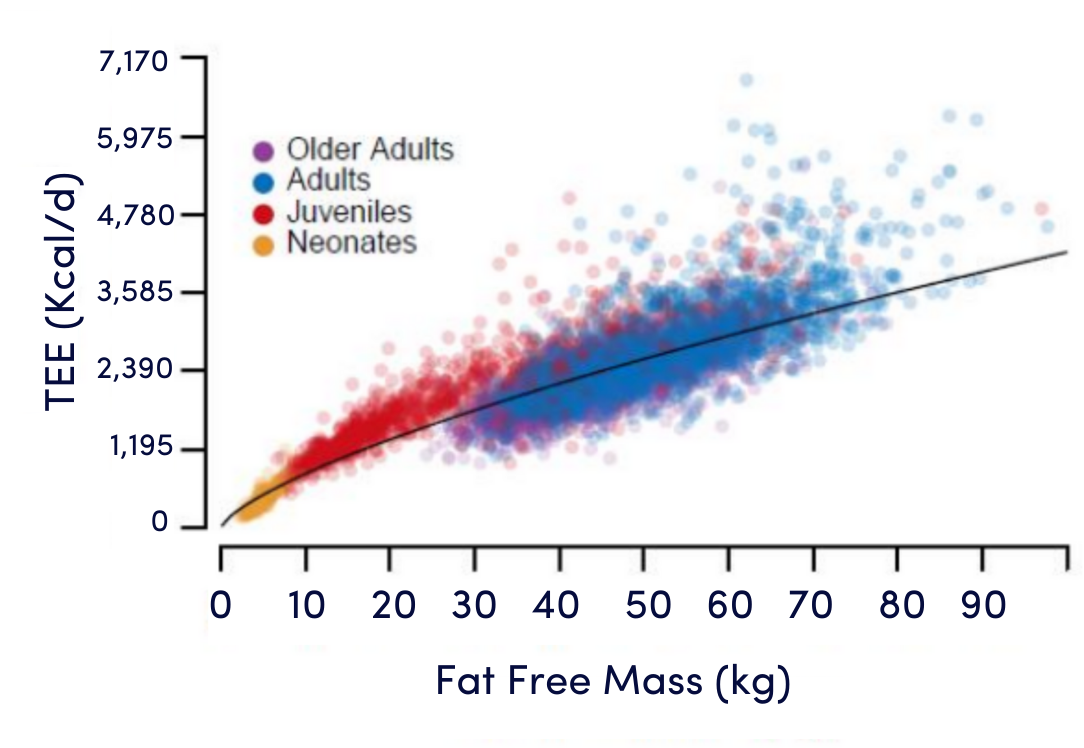
Figure 3. Graph illustrates the relationship between TEE and fat free mass (FFM) in a power-law manner. However, age groups cluster about the trend differently. (Adapted from Pontzer 2021, figure 1. [7])
Pontzer et al. 2021 used DLW database TDEE data to explore how expenditure varies as we age. He demonstrated that it does, and there are “four distinct metabolic life stages reflecting changes in behavior, anatomy, and tissue metabolism.” [7] These stages are neonates (0-1 y), juveniles (1-20 y), adults (20-40 y), and older adults (>60 y). Across these stages, Pontzer “found that both total and basal expenditure increased with fat free mass in a power-law manner. Thus body size, particularly fat free mass, accounted for most (83%) of the variation in daily expenditure.” [7]. When adjusted for body size, neonates burn about 50% more than adults, juvenile TEE slowly drops from 1-20 y and plateaus when they hit 20, entering the adult phase with a steady TEE until they reach 60 y, where TEE beings to decline along with FFM (for subjects >90, adjusted TEE was ~26% lower than middle-aged adults). [7] Overall, the relationship between TEE and FFM can be described in a power-law manner. However, TEE is still highly individual as demonstrated by the spread of individual data points in figure 3.
It has been established that exercise and TDEE are related and important for optimizing body composition, but what are the limits to what humans can sustainably spend? Thurber et al. 2019 answered this question through maximum sustained metabolic scope (SusMS). They demonstrated that sustained expenditure in humans is based on event duration [8]. They looked at DLW measurements made during endurance events. For events that last between 0.5-250+ days, SusMS decreased dramatically, but eventually plateaued below 3x BMR [8]. When considered with additional data from overfeeding studies, the sustainable energy supply limit in humans is revealed to be ~2.5x BMR [8]. Sustained energy expenditure beyond this limit for extended periods results in negative consequences like injury.
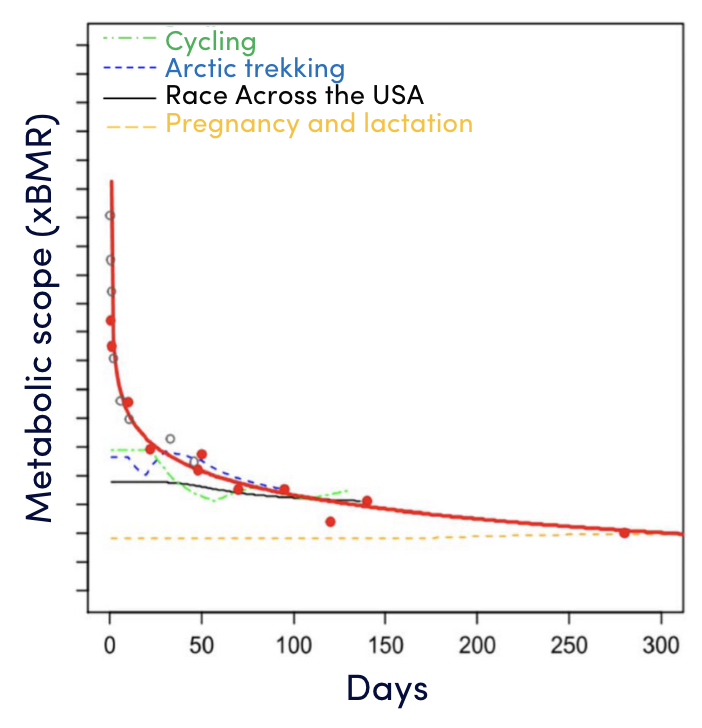
Figure 4. Graph illustrates the sustainable metabolic scope (SusMS) versus duration relationship, showing that it flattens out at about 2.5x BMR. Data was acquired from elite cyclists’ touring season, arctic trekking, RAUSA runners, and pregnancy and lactation. (Adapted from Thurber 2019, figure 1. [8])
Westerterp et al. 2021 is another example of DLW being used for TDEE and body composition. This study found that physically active people have higher FM-adjusted FFM, and is especially true for those who have completed their juvenile phase and have moved into their more steady adult phase of life [9]. This shows that physical activity is a major determinant of body composition. However, older age lessens the effect physical activity has on body composition [9]. This suggests that exercise is an important factor in determining body composition during the adult phase, but it can only partly protect against FFM loss in older adults.
Taking a turn away from exercise, DLW has also been used in the context of burn victims. In Goran et al. 1990, they measured the TDEE of children who had been severely burned and were recovering in the hospital. These children were sedentary, and if they weren’t going through so many repairs, they would have a Physical Activity Level (PAL) of about 1. PAL is the ratio of TDEE over basal metabolic rate (BMR), normally used in cases like Thurber 2019 to determine sustainable metabolic limits. These children, however, had an average PAL of 1.33, showing that their body was going through intense repair that required substantial energy [10]. This means, if a child in this study had a BMR of 1000 kcal/day, they would be burning about 300 calories a day on repairs (the equivalent of playing soccer for 30 minutes). This shows that activities that are often thought of as background noise like healing have a noticeable impact on TDEE.
Finally, in the context of energy balance, Schoeller 2008 explored the relationship between weight gain and energy expenditure. This study debunked the idea that overweight individuals have a “slower” metabolism than leaner individuals, and that weight gain is not actually associated with lower energy expenditure [11].
Clinical Pharmacokinetics and DLW Opportunities
There is ample opportunity for clinical pharmacokinetics (PK) to benefit from the insights associated with DLW. Clinical PK refers to applying the knowledge about how a drug is metabolized to effective drug management for an individual patient.
“The ideal drug therapy is to achieve the right dose, of the right drug, for the right time, in the right patient.” [12]
To date, there has been no substantial research on TDEE effect on PK [13]
Until now, DLW was prohibitively expensive for PK research, resulting in reliance on population data for making assumptions about drug interactions in individuals
The use of body surface area (BSA) for drug dosage relies on weight and height, ignoring body composition which could lead to a variety of negative effects [12, 14]
Baker et al. 2002 showed that BSA-based dosing only improved outcomes for 15% of the drugs in the study. Prado et al. 2011, however, showed that LBM could be more promising, demonstrating that individuals with the same BSA had varying LBM and patients with lower LBM had greater incidence of toxicity [15, 16]
Exercise may affect PK due to temporarily increased blood flow, therefore increasing the amount of drug that reaches receptor sites at specific organs, effecting side effects [13]
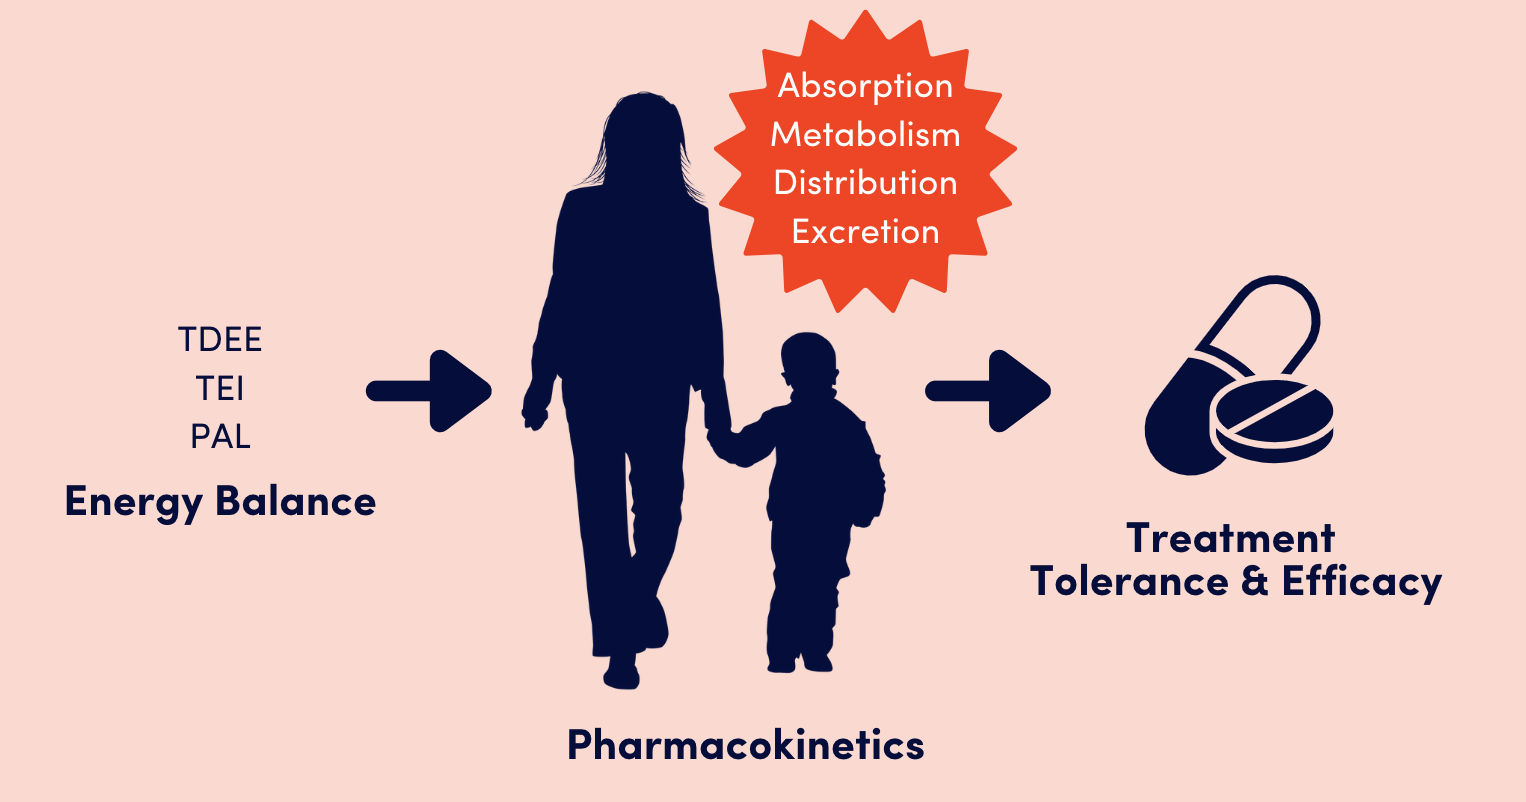
Figure 5. Various impacts of energy balance on pharmacokinetics of cancer therapeutics. (Adapted from Purcell 2023, figure 1. [11])
Future Implications
Calorify has built the largest DLW lab in the world and is democratizing DLW testing, leading us to create the largest metabolic dataset to date. With this data, we hope to:
Answer questions about metabolic diseases, with a focus on cancer, obesity, etc.
Help investigate drug efficacy and hone drug dosing requirements
And much more…
References: [1] Westerterp, Eur J Appl Physiol 2017; [2] International Atomic Energy Agency, IAEA Human Health Series No 13. 2010; [3] Lifson, et al. J Biol Chem 1949; [4] Pontzer, et al. DLW Database 2020; [5] Speakman, Am J Clin Nutr 1998; [6] Melanson, et al. Am J Physiol Endocrinol Metab 2018; [7] Pontzer, et al. Science 2021; [8] Thurber, et al. Sci Adv 2019; [9] Westerterp, et al. Am J Clin Nutr 2021; [10] Goran, et al. Am J Physiol 1990; [11] Schoeller, Int J Obes 2008; [12] Begg and Chin, Br J Clin Pharmacol 2012; [13] Purcell, et al. JNCI Monographs 2023; [14] Morgan and Bray, Clinical Pharmacokinetics 1994; [15] Baker, et al. J Natl Cancer Inst 2002; [16] Prado, et al. Cancer Chemother Pharmacol 2011